

Professional success pairs best with personal fulfillment.
Percentage of graduates employed or continuing their education within 6 months of graduation
Recipients of the prestigious Watson Fellowship since 1969
STEM Ph.D. producer in the country
Our rank on Forbes’ 2019 list of the Grateful Graduates Index
Multi-interested students transform into multi-talented alumni through the power of a liberal arts education. You’ll find Lawrentians working in laboratories, expressing themselves on stage and screen, creating policies that shape our world, starting and leading companies, and playing professional sports. Our tradition of academic excellence will provide you with a basis to explore the world of advanced study. Hall of Famers, Nobel Prize winners, Fulbright scholars, Rhodes scholars, Goldwater scholars are all among the ranks of alumni who once studied on the banks of the Fox River.
Discover Career Communities that sharpen your post-graduation interests
Lawrence's Career Communities help you connect with alumni mentors, explore internship opportunities, and learn more about how your Lawrence experience can help support your career goals and aspirations. Join up to three of eight different communities, ranging from health care to performing arts– change your preferences any time!

Here Comes Success
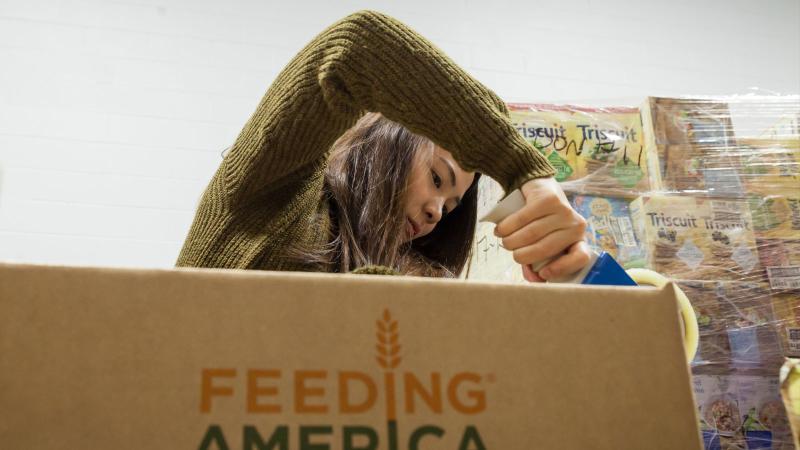
From the day you step on campus, the Career Center becomes your partner in success. Plan for your brightest future with the help of a dedicated staff ready to help you make alumni connections, explore professional opportunities, and prepare yourself for life after Lawrence.

Meet Our Shining Lights
Lawrence alumni shine their light brightly in the world every day. They work at tech giants like Apple or LinkedIn or explore the arts at the Field Museum of Natural History or the Fox Valley Symphony. They are Hall of Famers, Nobel Prize winners, and Fulbright, Rhodes, and Goldwater scholars, as well as teachers, doctors, and entrepreneurs.
Watsons, Fulbrights, Rhodes & More
Lawrence can help you pursue fellowships or other awards that fund graduate study, teaching abroad or in the United States, research, federal employment, or public service
LU Outcomes
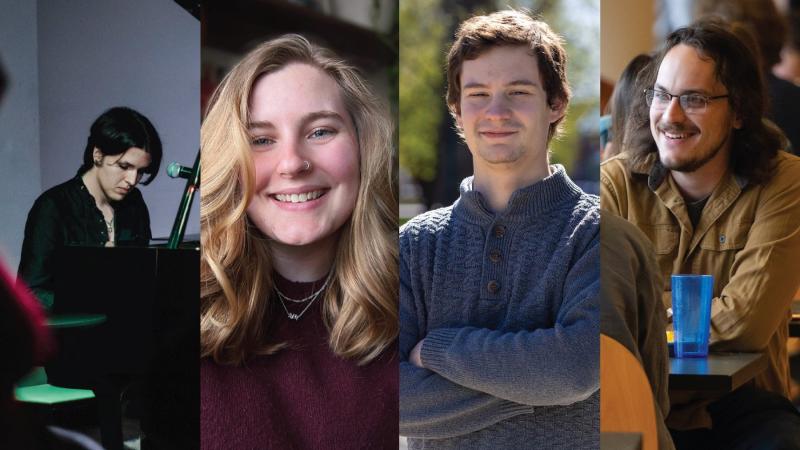
Lawrence University senior Jonathan Bass and 2023 graduates Gunner Bauer, Miri Villerius, and Ayla Walther have been named 2024 Fulbright Scholars, a prestigious honor that provides funding to study or teach abroad.

A Musical Journey | This is Lawrence
As a student in the Conservatory of Music, Martha McDonnell ’14 found a way to balance her two distinct musical interests: classical violin performance and fiddling. Her unique skill set landed her a spot in Sting’s musical The Last Ship before she had even graduated, and she’s since performed on Broadway in Steve Martin’s Bright Star.

Nicolette Puskar ’19 is keeping both science and music close to her heart. The Lawrence University alumna is working toward her Ph.D. in physical chemistry. She's also preparing to sing at Carnegie Hall.